Research
Forecast, Measure, Optimize.
A workflow-level model for the value and consumption of agentic AI.
Abstract
Enterprise AI business cases usually produce one number, the value of deploying, and leave the second number, what it will cost to run, to be discovered in the first invoice. This paper presents a workflow-level model that produces both from the same inputs. A workflow is decomposed into steps with measured human effort; each step is assigned a disposition describing what it becomes with AI; each disposition removes a calibrated fraction of effort along a bounded ramp; and each AI-touched step carries a consumption profile priced in the vendor's billing unit.
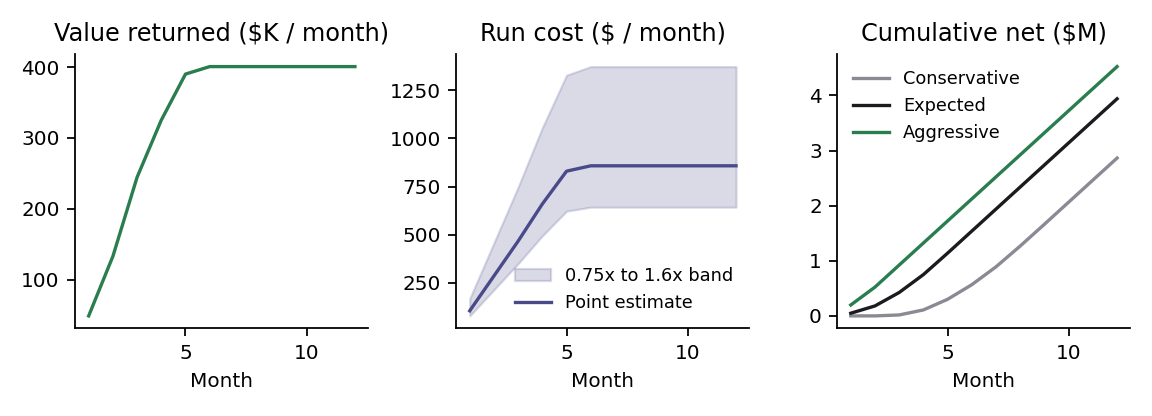
The model yields month-by-month hours returned, value, run cost with an asymmetric confidence band, net value, and payback, and it is designed to be re-estimated from telemetry once the workflow is live. The paper describes the model, the reasoning behind its structural choices, a calibration procedure, a regime map showing where run cost is and is not material, a worked example, and a candid separation between what the framework settles and what remains to be learned.
Try the two numbers
Figures
What the framework settles
- Value and run cost come from the same step-level decomposition and should be forecast together.
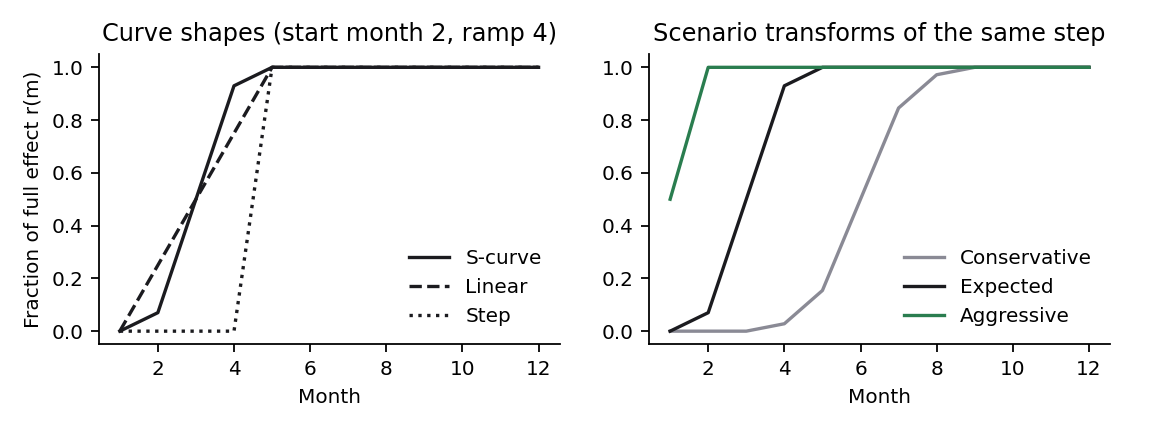
- Both lines ramp. Assuming full-volume cost from month one, or full-volume value, distorts the case.
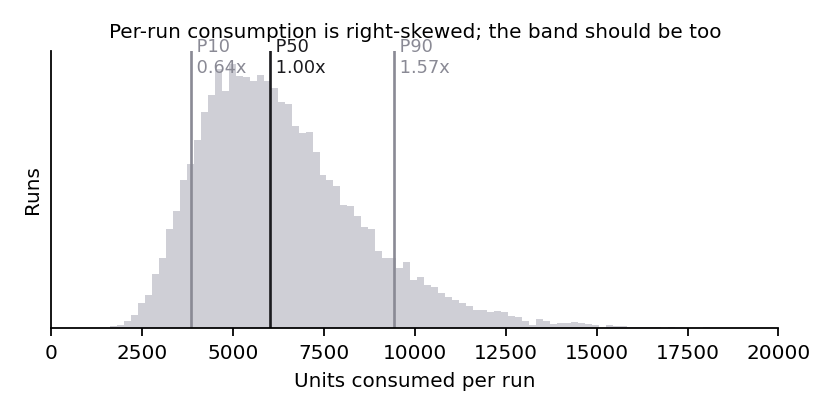
- The consumption band is lopsided. Per-run consumption in agentic systems is right-skewed.
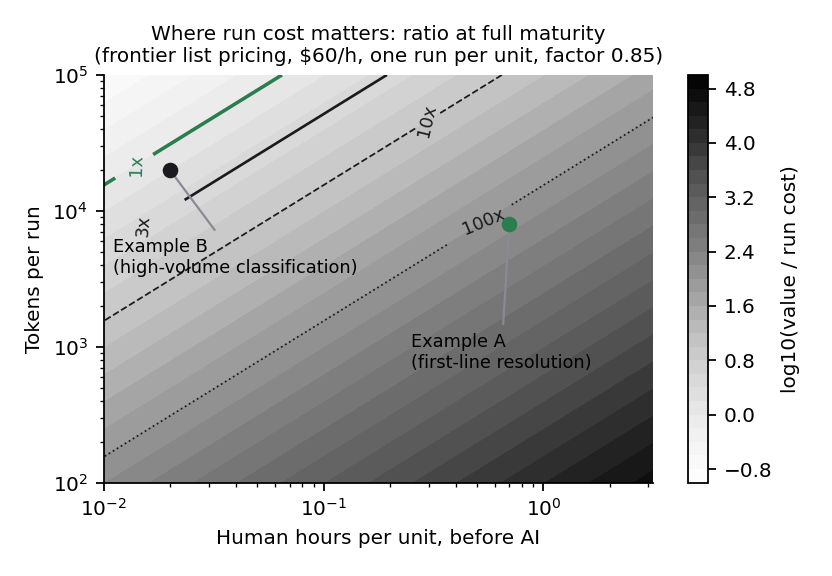
- Whether run cost matters at all is predictable before anything is built, from hours per unit and consumption per run.
- Every parameter has a measured counterpart, so telemetry replaces assumptions step by step after launch.
What is still being learned
- Disposition factors are priors, not findings, and almost certainly vary by domain.
- Returned hours are not savings. The conversion coefficient is unknown beyond "less than one."
- Cheaper workflows often grow in volume. The model treats volume as fixed.
- Steps interact, and automated steps that are wrong create rework the model has no term for.
- Human-kept steps can get slower when the AI brief has to be verified.
The measurement half of this model is the same discipline I applied in production at an Anthropic partnership practice: per-workflow cost observability and per-company value tracking. If you want it applied to a portfolio, book a 30-minute call. To run your own numbers first, the calculator gives you both in five minutes.
None of the open questions change the structure. All of them are calibration, and calibration is what I expect to publish next. If you have post-deployment data that would sharpen any of these parameters, I would like to hear from you; the address is in the footer.
What is next for the model is on my desk.
The Second Number · a letter from Korey
A letter on the number most business cases leave off: what it costs to run.
Subscribers hear when v0.2 lands, with the calibration notes. One idea you can take into a board meeting, one number you can check, and nothing I would not say to a board.
A few times a year, when there is something worth your time. Unsubscribe in one click. I never share the list.
The reference model
A short Python reference implementation reproduces the worked example in the paper: the step decomposition, dispositions, S-curve ramps under three rollout scenarios, and the asymmetric consumption band. It is a reference model, not a library. Read it alongside Section 3 of the paper.
fmo-v0.1-model.py →Cite as
Dillon, K. (2026). Forecast, Measure, Optimize: A Workflow-Level Model for the Value and Consumption of Agentic AI. Working paper v0.1, LatentAxis. Zenodo. https://doi.org/10.5281/zenodo.23197852
Changelog
- · v0.1 released: working paper, four figures, and the reference model. Deposited on Zenodo.
- Next · v0.2, the calibration release. Undated until the data is in.